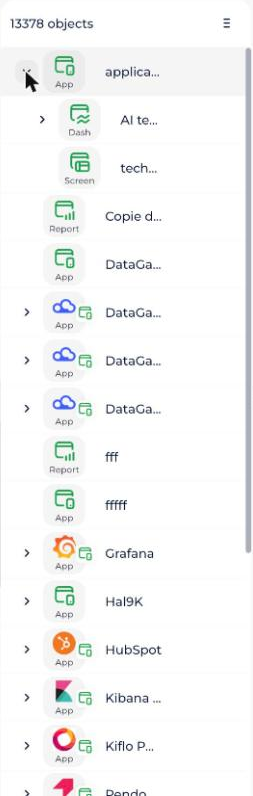
To document all your interfaces, DataGalaxy provides a set of objects.
Which objects can you document?
- Application: represents the data available in a database, whether mobile, web, etc.
- Dashboard: graphically represents glossary data from one or more models.
- Screen: a use case via an interface — the display of elements on an application or ERP page, for example.
- Algorithm: a set of operations performed in a specific order to obtain a result from data provided as input.
- Dataset: a collection of elements where associated data is stored, and where each value is associated with a variable.
- Open dataset: a dataset whose access and use are left free to the public.
- Report: a debriefing, a representation of information at a point in time.
- Feature: a capacity or service provided by applications or screens.
- Usage field: describes the columns of a dashboard, for example.
- Usage component: covers the entire perimeter of the BI. It can be seen as a generic child, used to represent any element of a report, dashboard or screen (sheet, tab, graph, matrix, table, header...). It can even point to an existing component (sub-report, report tiles...). We have decided to limit the attributes in the component's object card because it may evolve in future versions.
- Usage: lets the company's DPO keep the record of processing activities up to date, to ensure GDPR compliance.
- Process: identifies all the processes within your company.