The Exploratory Data Lineage is DataGalaxy's new data lineage system, designed to optimize and enrich your data management experience.
It is based on innovations such as hierarchical boxes, virtual links, and improved exploration and visualization capabilities.
What are hierarchical boxes?
These structures let you see how data is connected, from the most general level down to very specific details such as columns. They organize data by families or kinships, helping you see clearly how each data set is related to the others.
- Link visualization: lets you view connections between the descendants of a specific object, improving understanding of data flows.
- Hierarchical grouping: organizes objects by kinship under the same box, making navigation and comparison between similar data groups easier.
- Restoration capability: significantly improves lineage analysis, with the ability to zoom down to the column level as needed.
To use them, zoom in to explore details at the column level and understand specific data transformations.
What are virtual links?
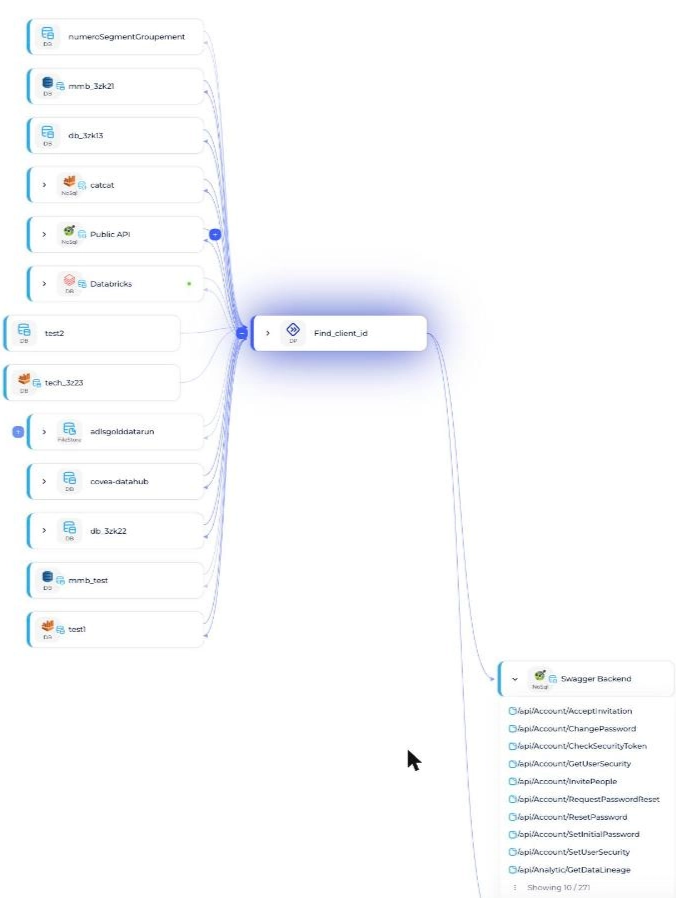
Links are displayed discreetly and become more visible (dotted) on hover, revealing the existence of hidden connections between objects not displayed on the screen.
To reveal virtual links, move your cursor over the objects.
How to explore the lineage virtually
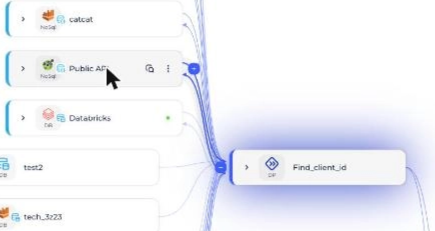
Your journey through the data universe shouldn't be linear or rigid. Dotted + buttons invite spontaneous exploration, letting you discover links between the descendants of an object without displaying those descendants.
Click a + button. Each click reveals new connections and paths, letting you navigate intuitively through complex lineages.
What is new in the path tracker?
Follow the path of your data with unmatched precision. The path tracker adjusts its display in real time as you explore different branches of the lineage.
Click the dots to activate this feature and visualize the complete data path as you explore different sections.
How objects are grouped under their parent
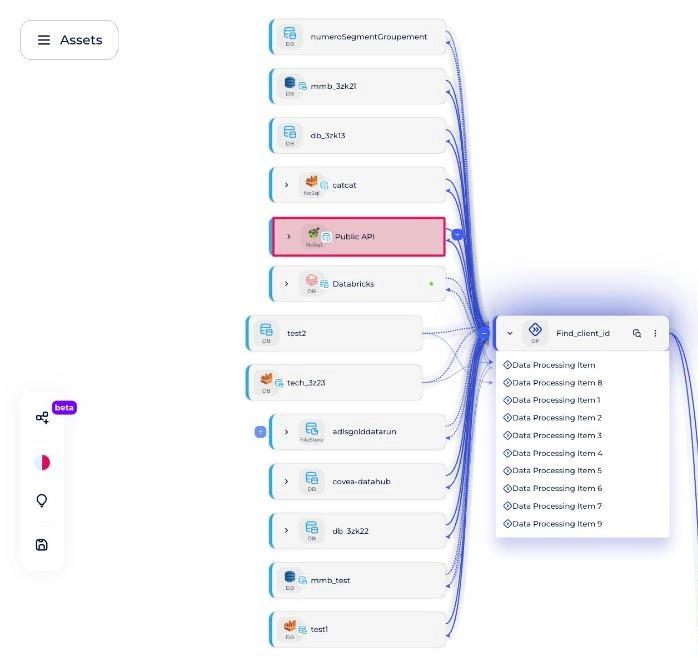
The lineage groups objects under their parent once the number of children exceeds 10, limiting the display to the essential elements for better readability.
Let the system organize your data automatically, showing only relevant information and reducing visual clutter.
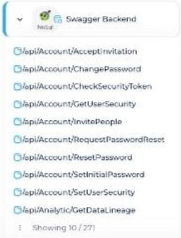
How to choose which objects are displayed
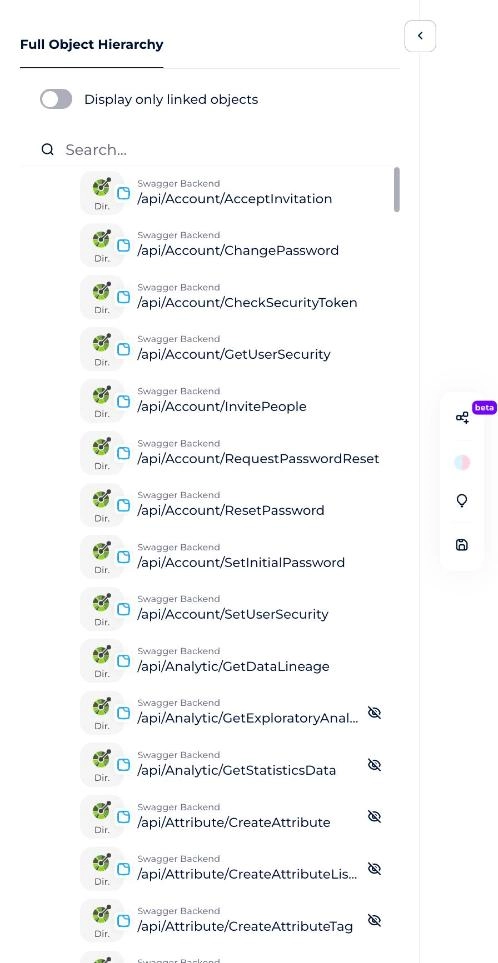
Control which objects are displayed or hidden in your hierarchy, so you can customize the view according to your analytical needs.
- Click the dots to the right of the object's name. The Full Object Hierarchy panel opens.
- Search the children, then show or hide each one.
- Turn on Display only linked objects for a more targeted analysis.
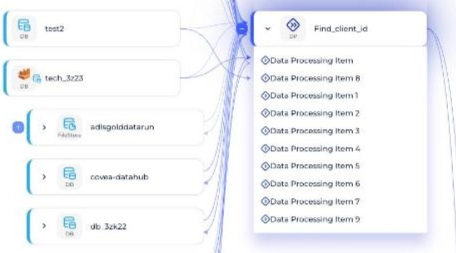
What is the DPI-level display?
Enjoy an extremely detailed visualization, perfect for analyses requiring high precision at the column level.
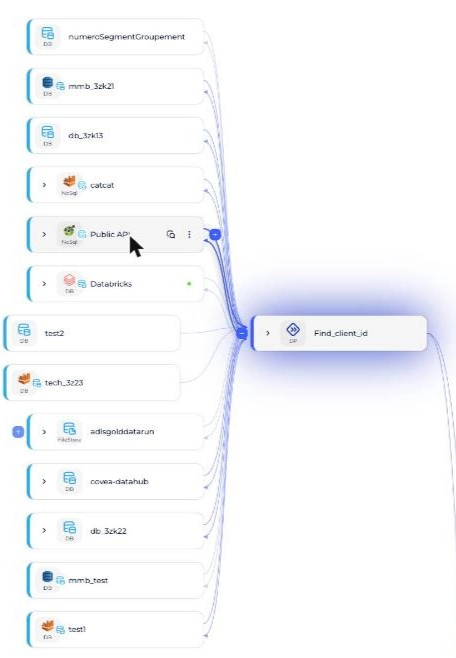
How to highlight upstream and downstream paths
Instantly visualize the impacts of data modifications thanks to the illumination of upstream and downstream links and objects on hover.
Move your cursor over the relevant elements to immediately discover critical data flows and their interdependencies.
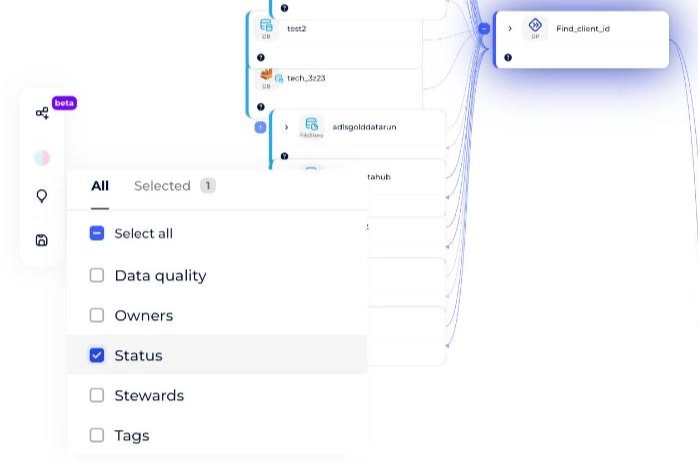
How to display extra data at the parent level
This feature groups additional information at the parent level for an enriched overview. Extending it to children is planned for an even richer overview.
Click the bulb icon in the menu to choose the additional data you want to display on your lineage: Data quality, Owners, Status, Stewards or Tags.
What is coming next?
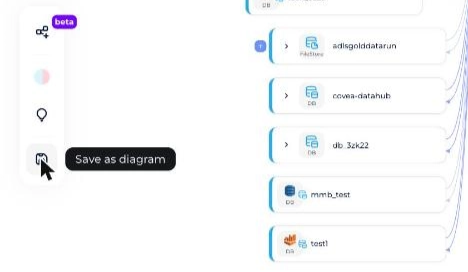
The Save as diagram feature will evolve, based on your feedback, to make it even better suited to your needs.