Use data lineage to trace the relationships between objects and analyze their impacts.
A data lineage shows the traceability of an object: both the objects it impacts and the objects that impact it.
How to start a data lineage analysis
- Search for an object of your choice.
- Click the object. It appears on screen with its links to the other objects.
You can zoom in and out, move all the containers, and collapse them if needed.
The first icon of the lineage toolbar switches between the Lineage view (Beta, see Exploratory Data Lineage), the Lineage full (Legacy) view and the Explorer. The 3 views, the reverse-direction and the hide-intermediate-levels icons described below are in the Lineage full (Legacy) view.
How to unfold the hierarchies
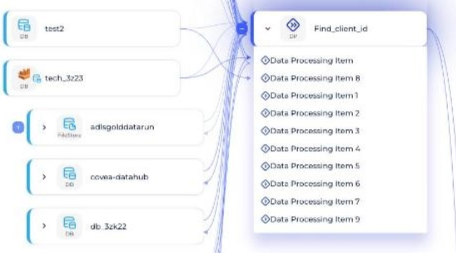
In the data lineage, you can group objects together for each hierarchy. For instance, columns are gathered in their table and tables are gathered in their model.
- Search for an object in the data lineage.
- Click the arrow to group or ungroup objects.
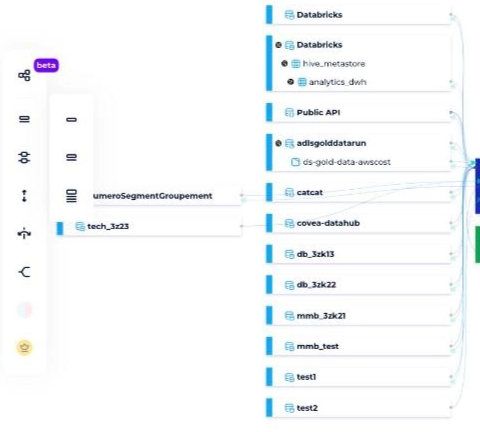
You can also change the level of detail from the module navigation toolbar, which offers 3 views:
- Simple: displays the highest level of the object hierarchy. It's the most synthetic view.
- Intermediary: displays the n-2 level from the highest level of the hierarchy.
- Detailed: displays the fully detailed lineage, the most detailed lineage possible.
How to load data processing items sibling paths (Beta)
Since version v3.2, to help deal with large lineages, the default display focuses only on paths linking objects through data processing items. Peripheral paths are no longer loaded by default, so lineages are easier to read and more straightforward in impact analysis cases. This also reduces the lineage's loading time.
The lineage displayed is similar to the highlighted path of the Path tracker feature explained later in this article.
You can still display the peripheral links with the Load Data Processing Items sibling paths button.
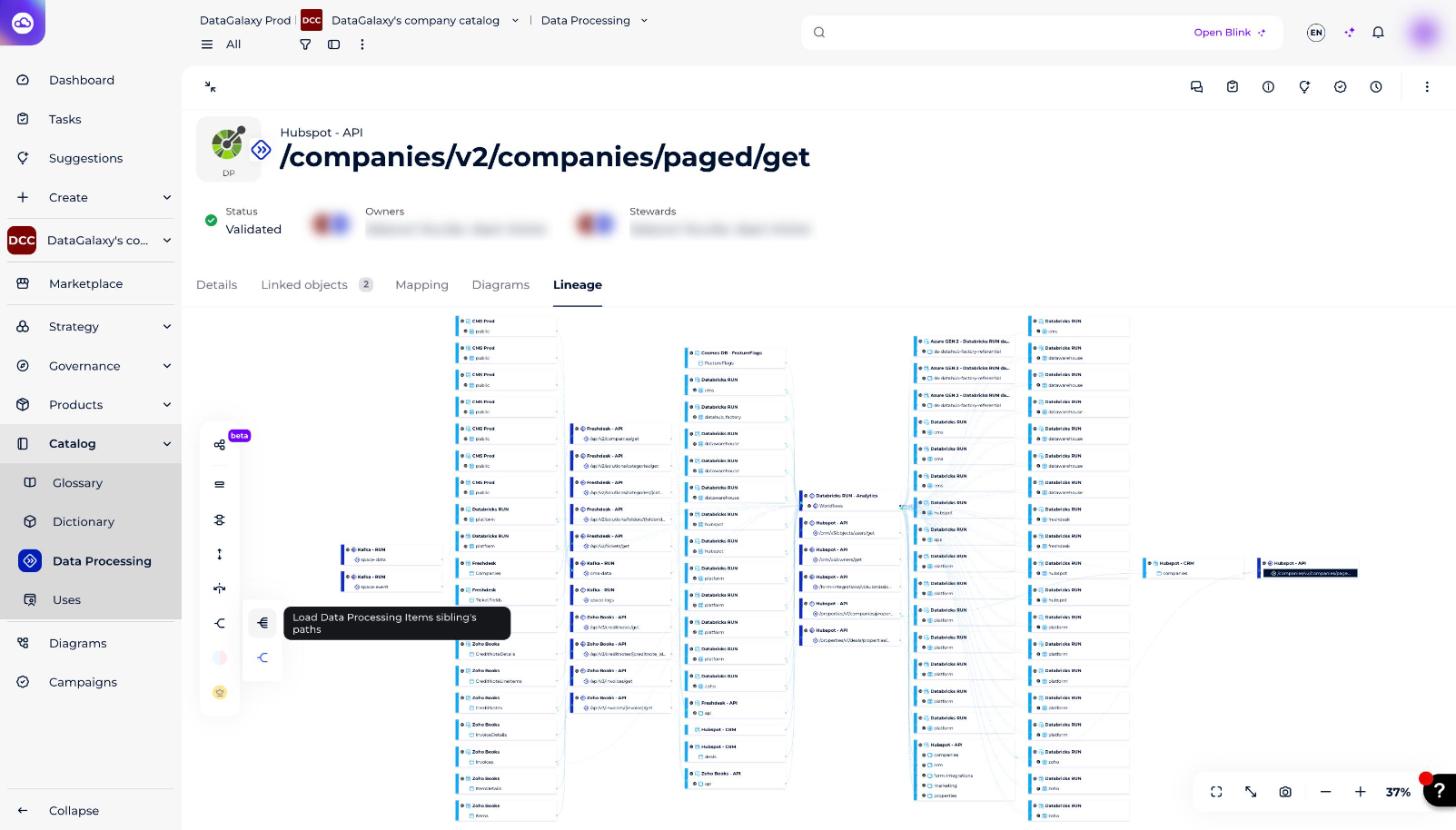
The button loads the paths that do not directly impact the source object of the displayed lineage but come into play in certain common processing operations (the default display before version v3.2). You can switch from one display to the other using this button.
- New default display, matching the Path tracker result: in the example, the red highlighted items are the Path tracker display, and only those items are shown.
- Display with the data processing items' sibling paths (former default display): in the example, the red highlighted items are the Path tracker display, and many other items are shown, because of paths that do not directly impact the source object of the displayed lineage but come into play in certain common processing operations.
How to hide the intermediate levels of the hierarchy
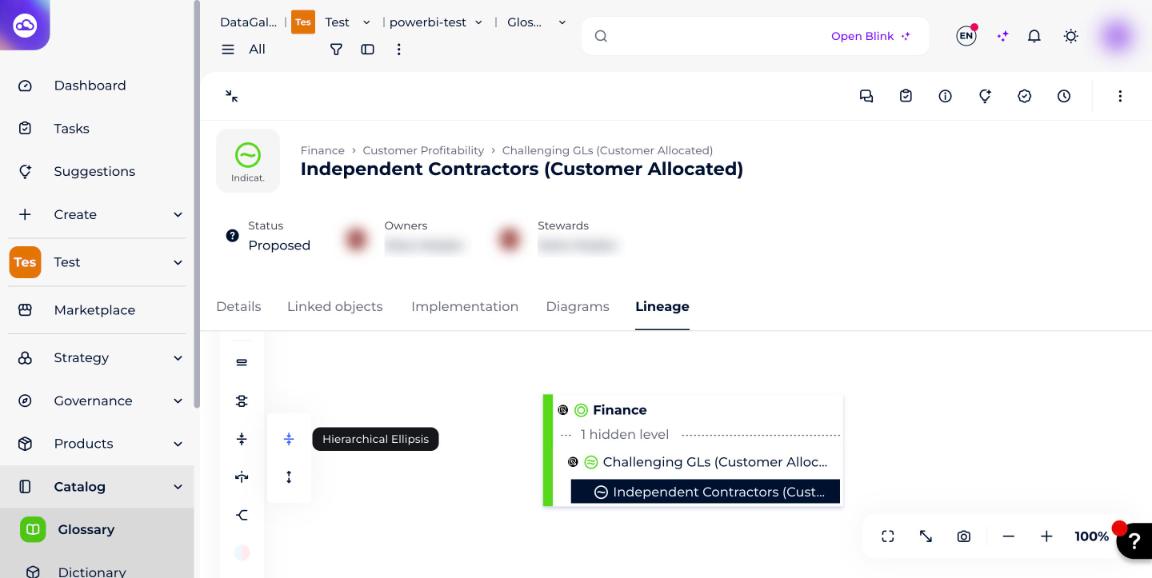
When you have a linked object in the data lineage, its entire higher hierarchy appears to provide context. In some cases the hierarchy can be too large and provide too much information. You can then hide all the intermediate levels of the hierarchy to show only the direct parent object and the highest parent object in the hierarchy.
To do this, click the corresponding icon in the lineage toolbar and choose Hierarchical Ellipsis. The hidden levels are replaced by a "hidden level" line.
How to reverse the direction of the data flow
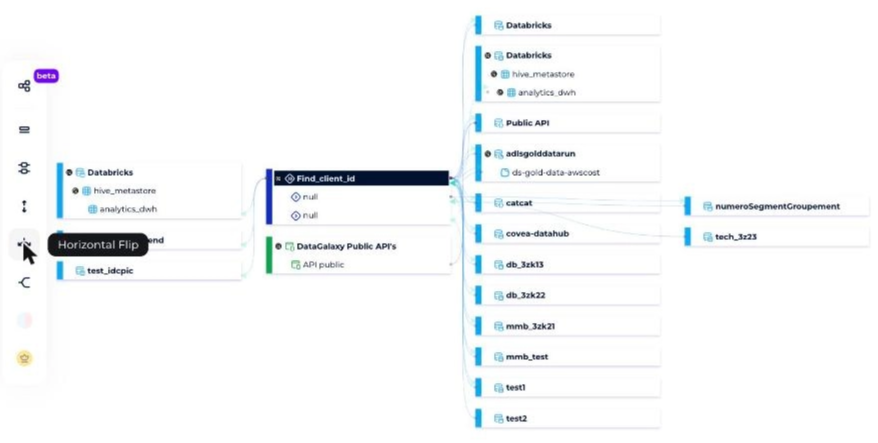
Depending on your use cases, it may be interesting to see the path of your data in a different direction. To reverse the direction of your data lineage, click the Horizontal Flip icon.
How to use the path tracker
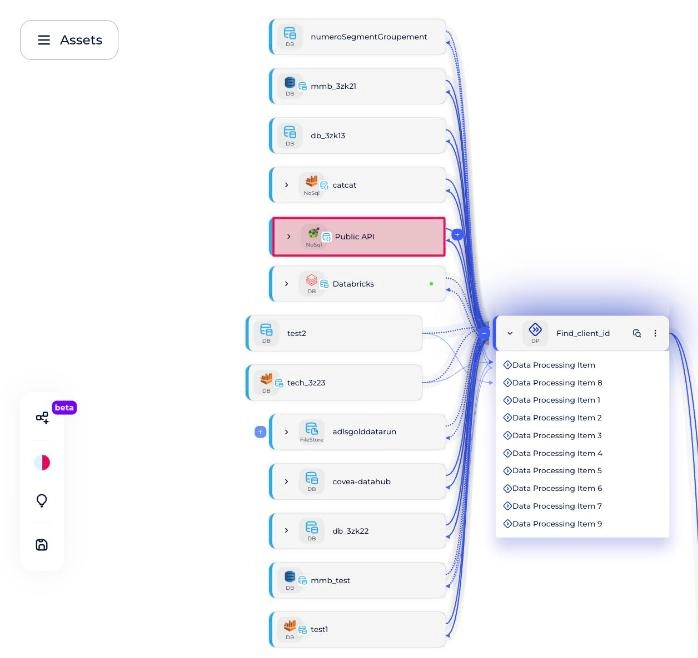
The path tracker helps you understand the impacts of your objects.
This feature is available in the menu located to the right of the object label. You can choose between 2 path colours: the blue path and the red path. Objects covered by both paths appear in purple.
To remove a path, click the circle of the path colour in the actions section at the top of the screen.
How to group and ungroup objects
You can ungroup and group objects from the dictionary and processing modules.
For dictionary objects (data sources and containers):
- The separation is made on the tables → the source object is divided into as many linked tables as it contains.
- The source object can also be separated into a single object if it has direct links.
For data processing objects (dataflow):
- The separation is made on the data processing operations → the source object is divided into as many linked data processings as it contains.
- The source object can also be separated into a single object if it has direct links.
How to display the lineage of another object
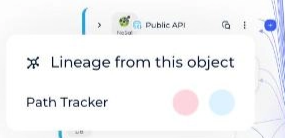
In the data lineage of an object, you can also display the lineage of another object shown in that data lineage. This feature is available in the menu to the right of the object label, by clicking Lineage from this object.
How to adapt the display to your screen
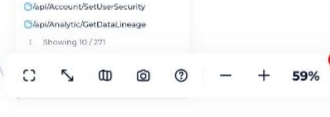
These buttons let you optimize the display of your lineage:
- Screenshot: saves an image of your lineage at time T in
.pngformat
- Ideal zoom: resizes and centers your display to fit your screen perfectly
- Full-screen mode: displays your lineage on your entire screen for more comfort
- Zoom in: enlarges the display
- Zoom out: reduces the display