Dashboards are built from widgets, each of which reports on one part of your catalog. There are 4 categories of widgets:
- General: the historical DataGalaxy widgets, which let you quickly view the content of your modules
- Counting: widgets that let you follow the count and the evolution of the number of objects in your modules
- Activity: widgets that let you track user activity in the client space
- Quality: widgets that translate the quality of your catalog through the filling and completeness of your attributes and objects
To learn more about creating, editing and deleting widgets, see Manage the dashboards.
General widgets
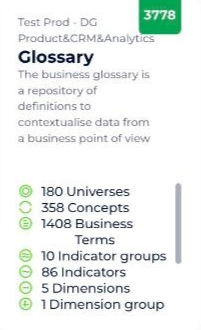
Module
- Description: lists all the objects present in a module selected from Glossary | Dictionary | Data Processing | Uses of a selected space.
- Example: enumeration of all the objects present in the Glossary of the Workspace version V1.
- Format of the representation: List
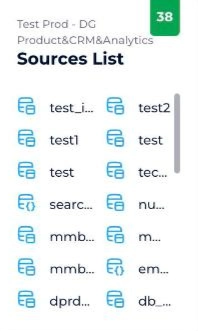
Items
- Description: lists the data sources of the objects present in the Dictionary module of a chosen space.
- Example: listing of all the data sources of the objects present in the Dictionary of the Workspace version V2.
- Format of the representation: List
Counting widgets
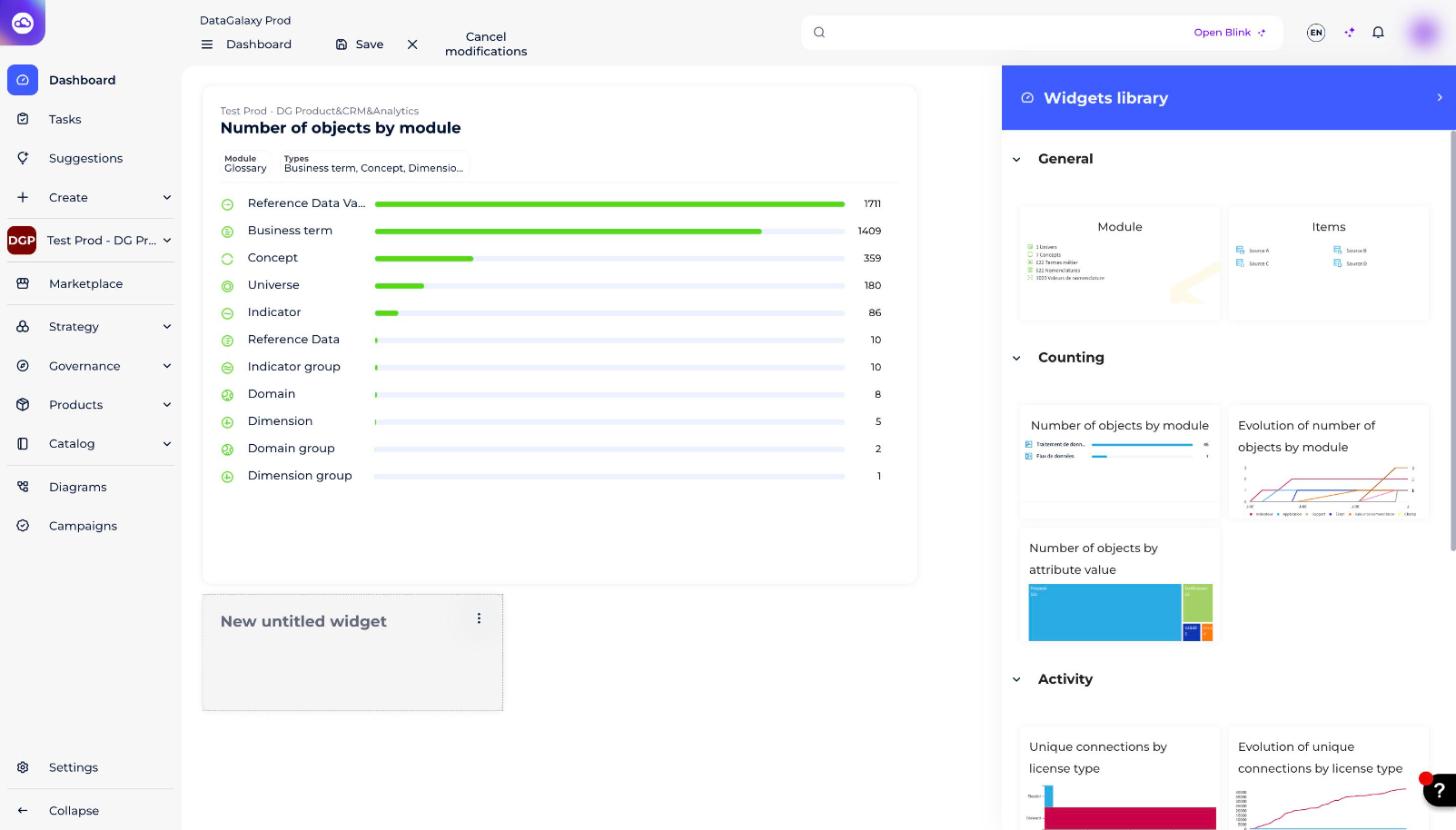
Number of objects by module
- Description: counts the objects of a module in a chosen space, with the possibility to filter on the Owner(s), the Steward(s) and one or more labels.
- Example: enumeration of objects (business term, universe, concept) in the Glossary of the Workspace space, where the Owner is Owner, the Steward is Steward and the label is CRM or Marketing.
- Format of the representation: Bar Chart
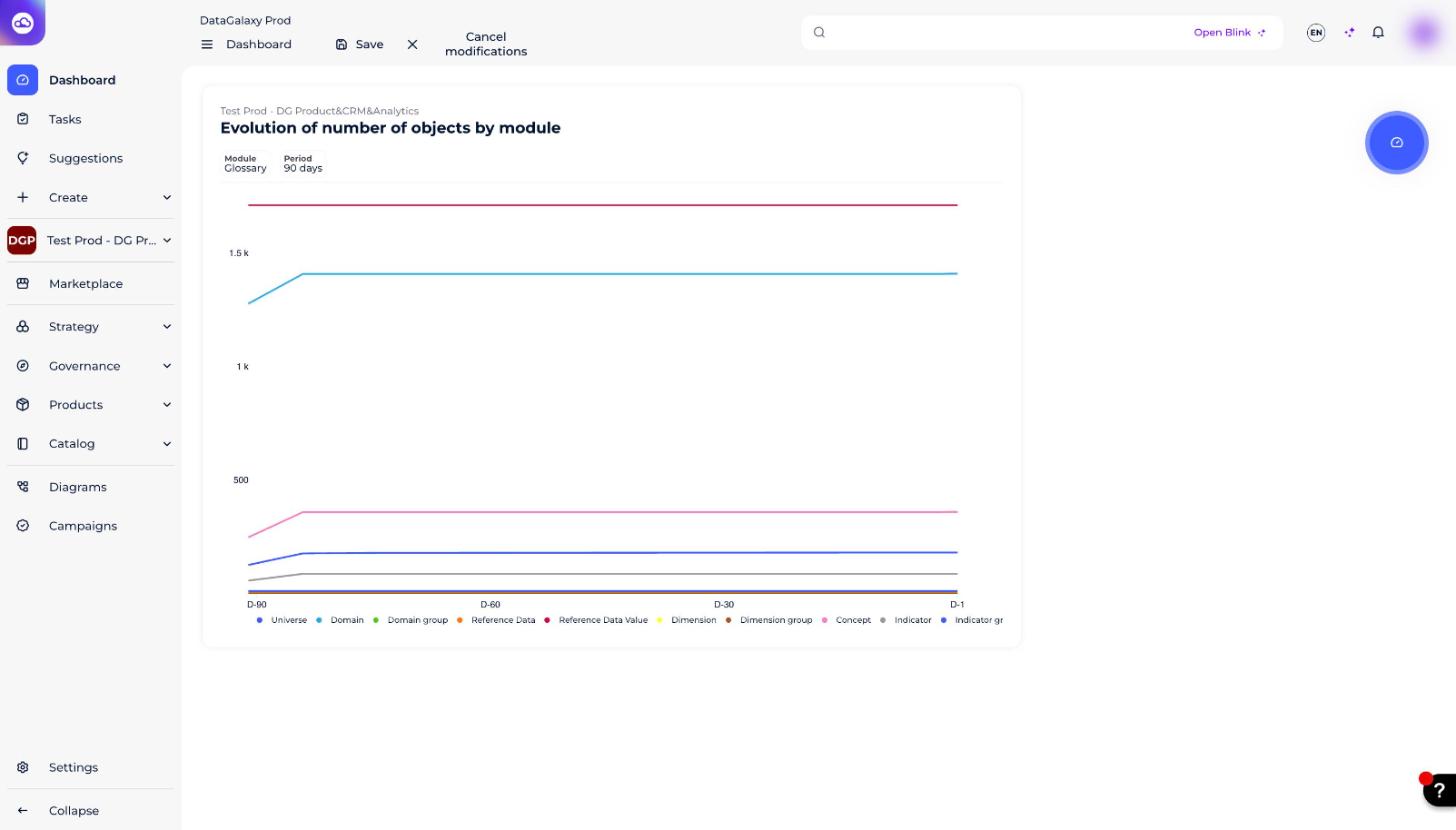
Evolution of number of objects by module
- Description: follows the evolution of the number of objects of a module in a chosen space over a period of time among 30 days, 60 days or 90 days.
- Example: evolution of the number of objects (indicator, group of indicators) in the Workspace Glossary over the last 60 days.
- Format of the representation: Curved diagram
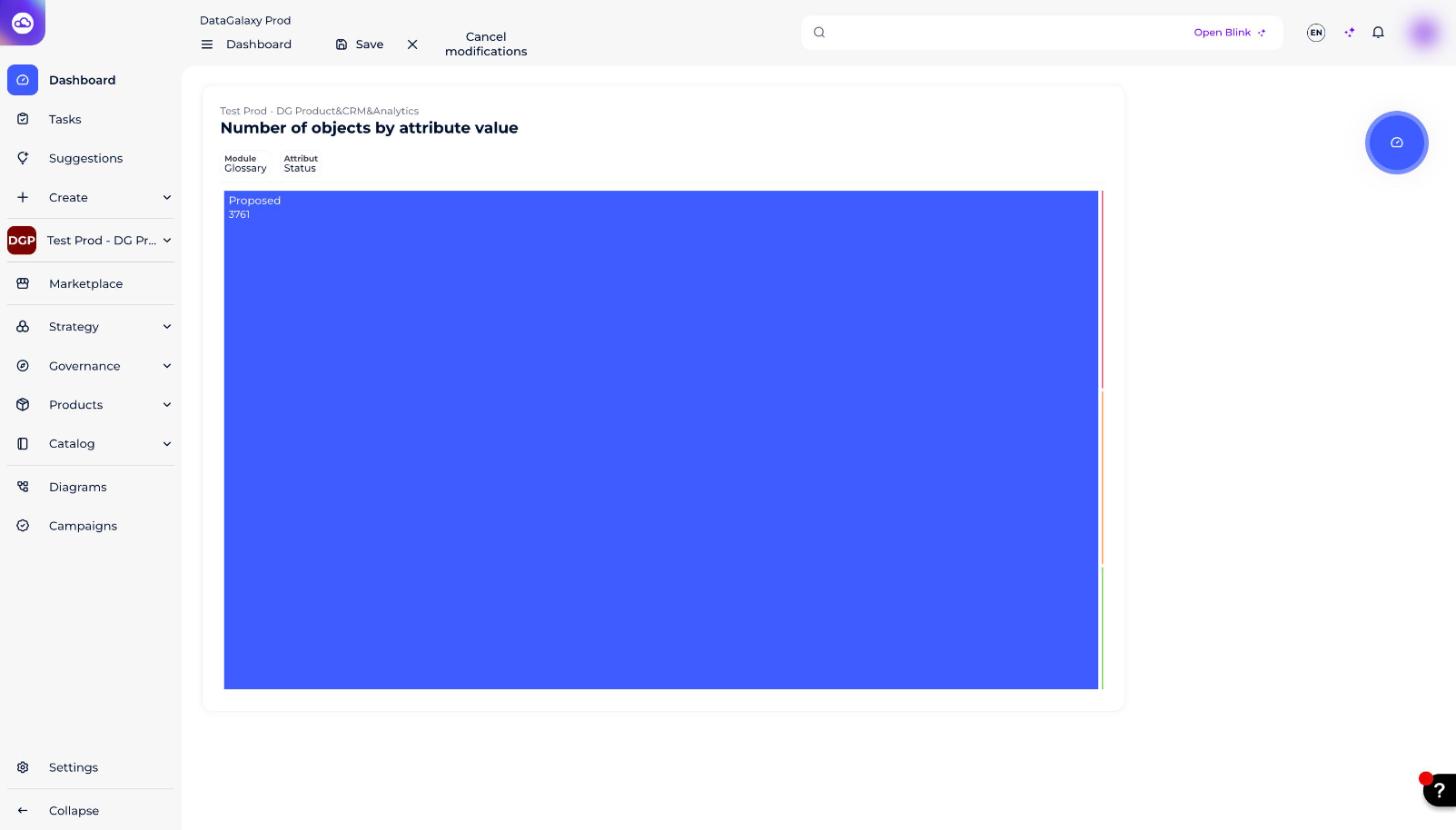
Number of objects by attribute value
- Description: counts the objects of a module in a chosen space and distributes them according to a distribution key among (Status | DCP Risk), with the possibility to filter on the Owner(s), Steward(s), status(s) and labels.
- Example: enumeration and distribution of the objects (domain, dimension, indicator) in the Glossary of the Workspace space whose Owner is Owner and whose status is validated, according to the DCP Risk distribution key.
- Format of the representation: Treemap
Activity widgets
In the activity widgets, the connections of day d are not taken into account: the calculation is made from d-1.
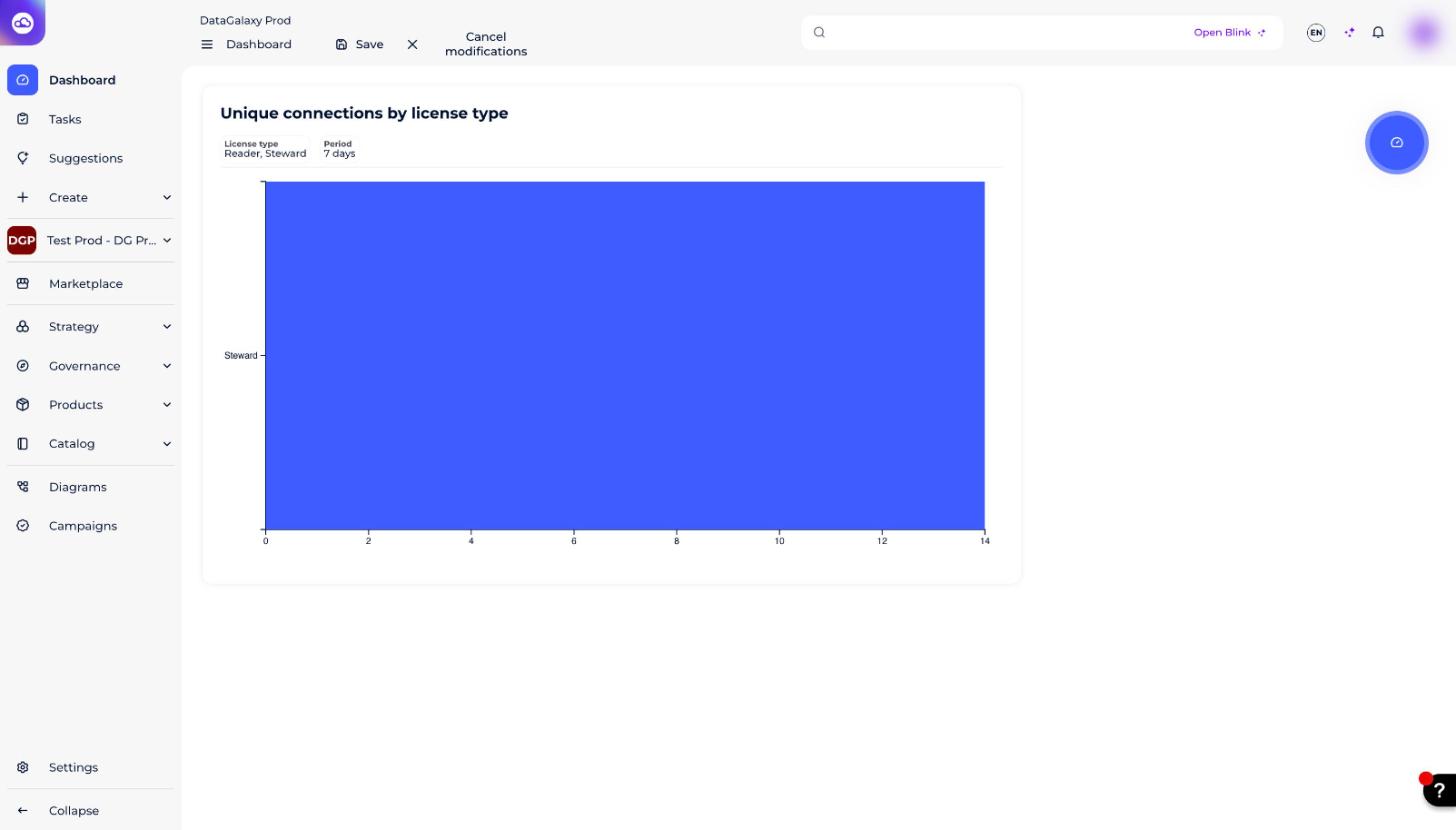
Unique connections by license type
- Description: tracks the number of unique connections per license type. You can choose one or more license types from Explorer | Reader | Steward, as well as a filter on the analysis period from 1 day | 7 days | 30 days.
- Example: number of unique connections from Stewards in the last 7 days.
- Format of the representation: Bar Chart
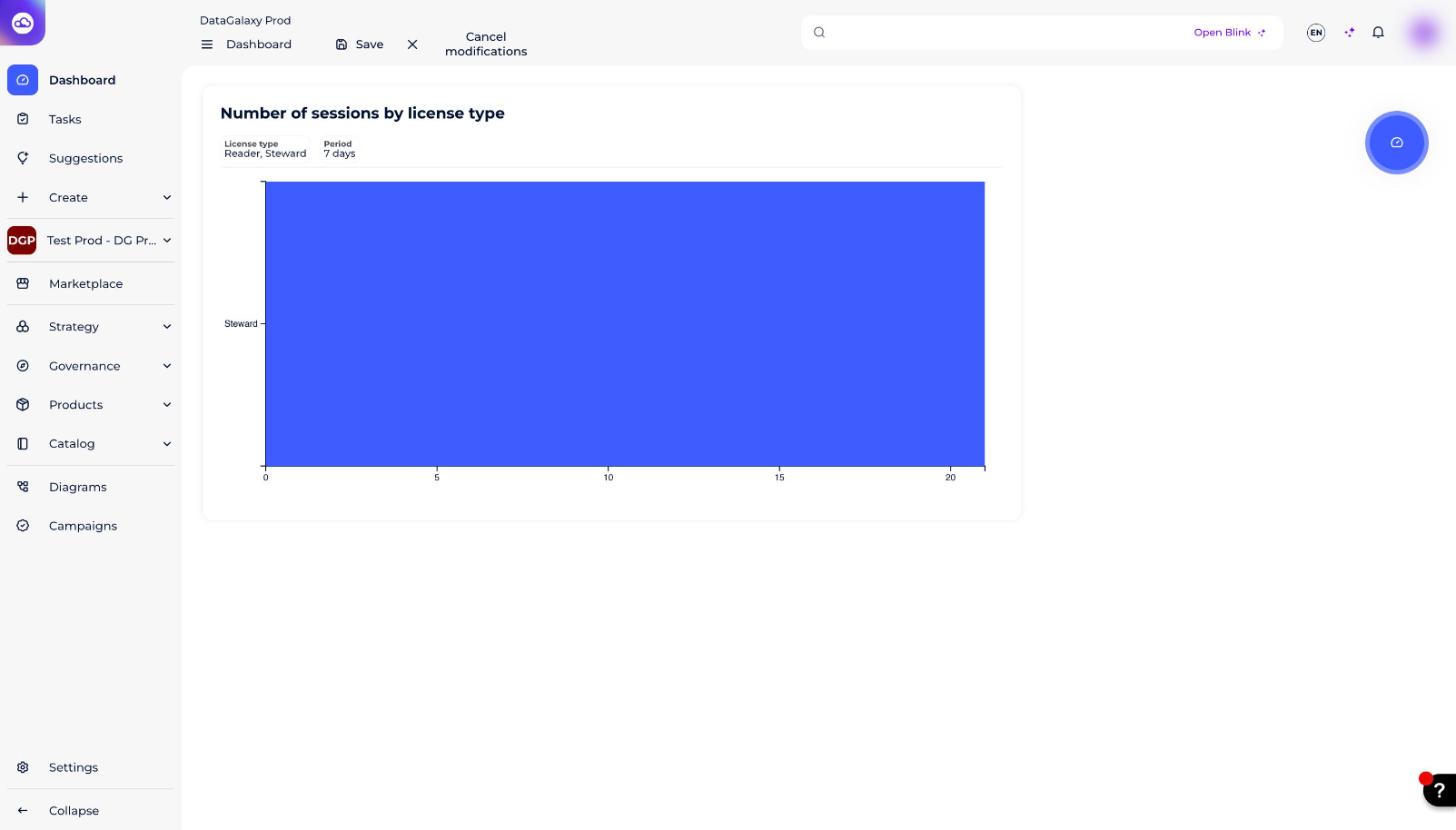
Number of sessions by license type
- Description: tracks the number of sessions per license type. You can choose one or more license types from Explorer | Reader | Steward, as well as a filter on the analysis period from 1 day | 7 days | 30 days.
- Example: number of Explorer and Steward sessions in the last 30 days.
- Format of the representation: Bar Chart
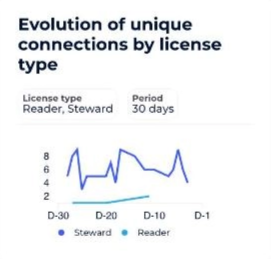
Evolution of unique connections by license type
- Description: tracks the evolution of the number of unique connections by license type. You can choose one or more license types among Explorer | Reader | Steward, as well as a filter on the analysis period among 30 days | 60 days | 90 days.
- Example: evolution of unique Explorer and Reader connections over the last 30 days.
- Format of the representation: Curved diagram
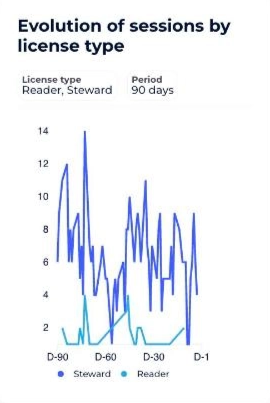
Evolution of sessions by license type
- Description: follows the evolution of the number of sessions per license type. You can choose one or more license types from Explorer | Reader | Steward, as well as a filter on the analysis period among 30 days | 60 days | 90 days.
- Example: evolution of the number of Stewards' sessions over the last 90 days.
- Format of the representation: Curved diagram
Quality widgets
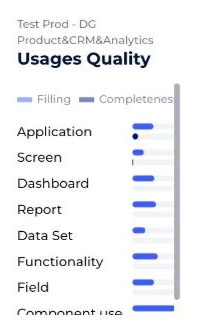
Graph
- Description: evaluates the quality of a module selected from Glossary | Data Processing | Uses of a selected space. The quality of a module is measured according to the fill rate of the objects.
- Example: quality of the objects present in the Workspace Uses version V1.
- Format of the representation: Bar Chart
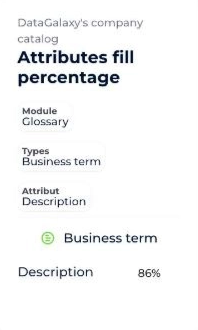
Attributes fill percentage
- Description: presents the attribute fill rates (Summary | Description | Custom attribute Free Text) of a selected object in a module of a chosen space.
- Example: the fill rates of the Description and Summary attributes in the Data Flow and Data Processing objects in the Workspace Processing module.
- Format of the representation: Bar Chart 100%
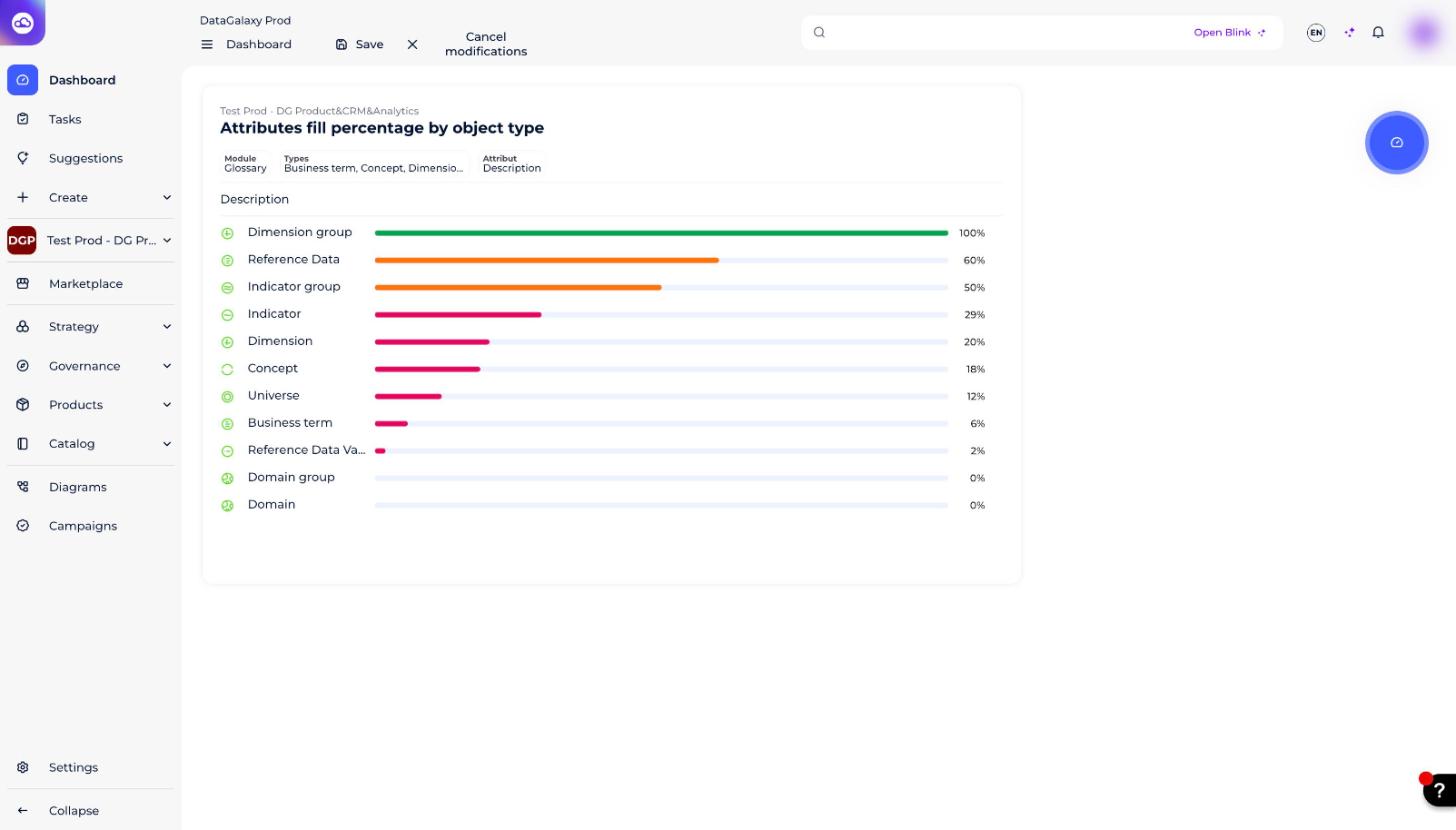
Attributes fill percentage by object type
- Description: presents the fill rates of an attribute chosen among (Summary | Description | Custom attribute Free Text) by type of object in a module of a chosen space.
- Example: the fill rate of the Description attribute in Report or Dashboard type objects in the Workspace Uses module.
- Format of the representation: Bar Chart 100%
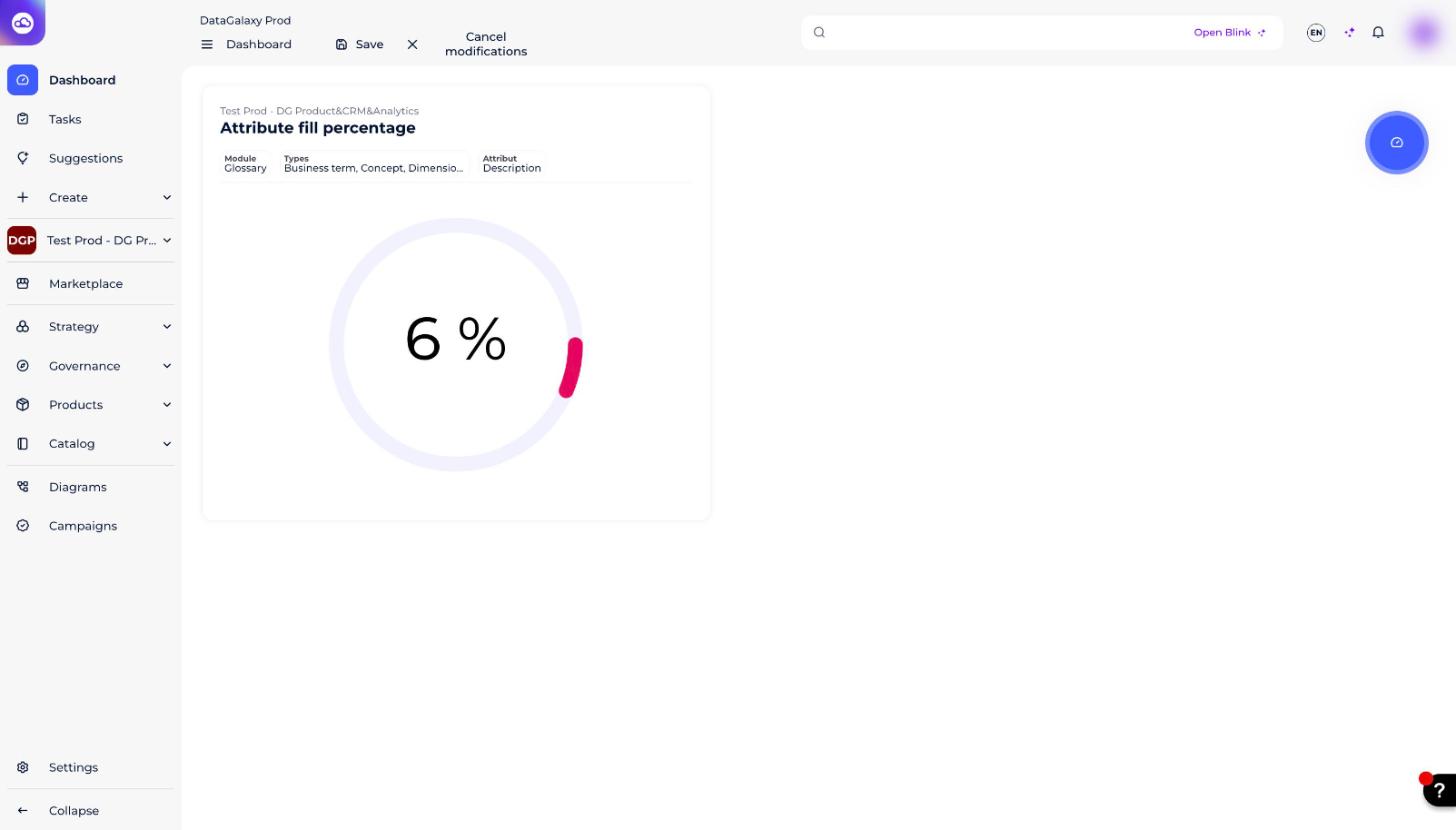
Attribute fill percentage
- Description: presents the fill rate of an attribute selected from (Summary | Description | Custom attribute Free Text) in several objects at the module level of a selected space.
- Example: the fill rate (combined) of the Summary attribute in the Field, Column and Database in the Workspace Dictionary.
- Format of the representation: Doughnut 100%
The meaning of the indicators present in the widgets can be found in Dashboard indicators.