Data quality is fundamentally about how well data meets the expectations of the people who consume it, and metadata is what makes those expectations explicit and clear — this framing comes from the DMBOK (Data Management Body of Knowledge).
A metadata catalog is therefore an essential tool for surfacing data quality. This typically happens in three steps:
- Define data quality.
- Represent the relevant indicators.
- Document the processes that bring data up to quality standards.
How to define data quality
Following DMBOK, there are several types of dimensions used to define the quality of a piece of data.
Objective dimensions
Dimensions that can be calculated:
- Completeness: the proportion of data actually stored, relative to the 100% potential.
- Uniqueness: no entity (thing) is recorded more than once, based on how that thing is identified.
- Timeliness: the degree to which data represents reality as of the point in time required.
- Validity: data is valid if it conforms to the syntax (format, type, range) of its definition.
- Accuracy: the degree to which data correctly describes the real-world object or event it represents.
- Consistency: the absence of difference when comparing two or more representations of a thing against a definition.
Subjective dimensions
Dimensions that depend on users' judgment at the point of consumption: usability, stability, flexibility, value, and trust.
A third category can be added: dimensions representing context. A given piece of data can be critical in one situation and much less so in another — for example, an incorrect date of birth matters a lot for a marketing campaign, but far less for billing.
How to represent quality indicators
In DataGalaxy, you can separate the functional and technical aspects of data quality.
The functional aspect
This represents the requirements that need to be met for business users to confidently use the data. To document this aspect, we recommend using the Glossary, which lets you:
- Describe the data you have.
- Attach it to business requirements where relevant, either:
- Using dedicated attributes, or
- Attaching it to Glossary objects that support those requirements.
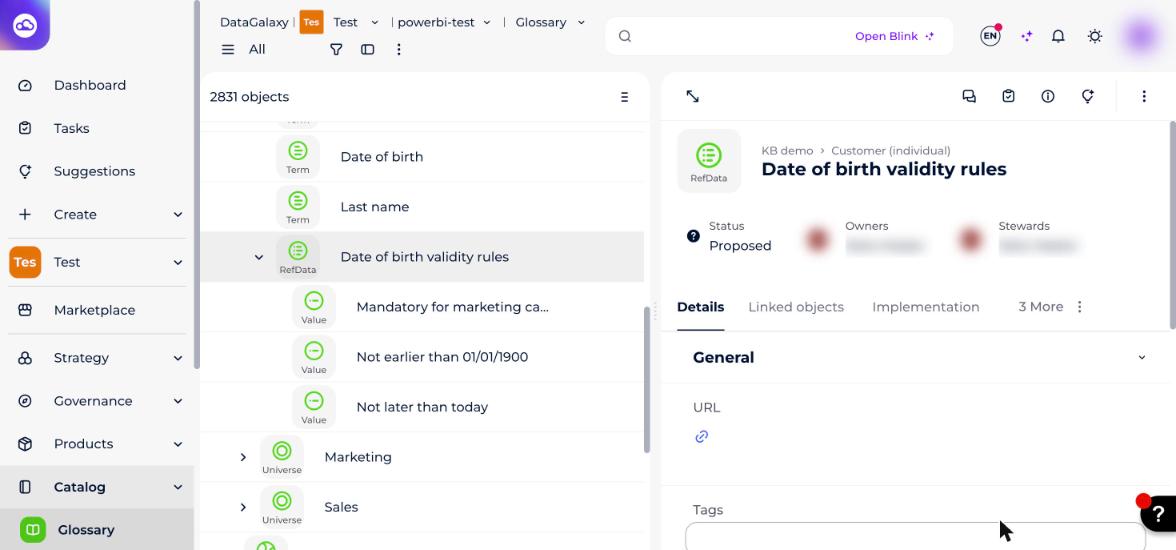
For example, you could specify that a business term "date of birth" is attached to the concept "customer," and that — regardless of the underlying system — the date of birth can't be earlier than 01/01/1900.
In the example below, a nomenclature is used to represent functional requirements.
The technical aspect
This covers all the measures that can be calculated for a database field. For each field, you can specify its quality along the dimensions described above, and track how that quality evolves over time using time-series indicators.
Connecting the two views
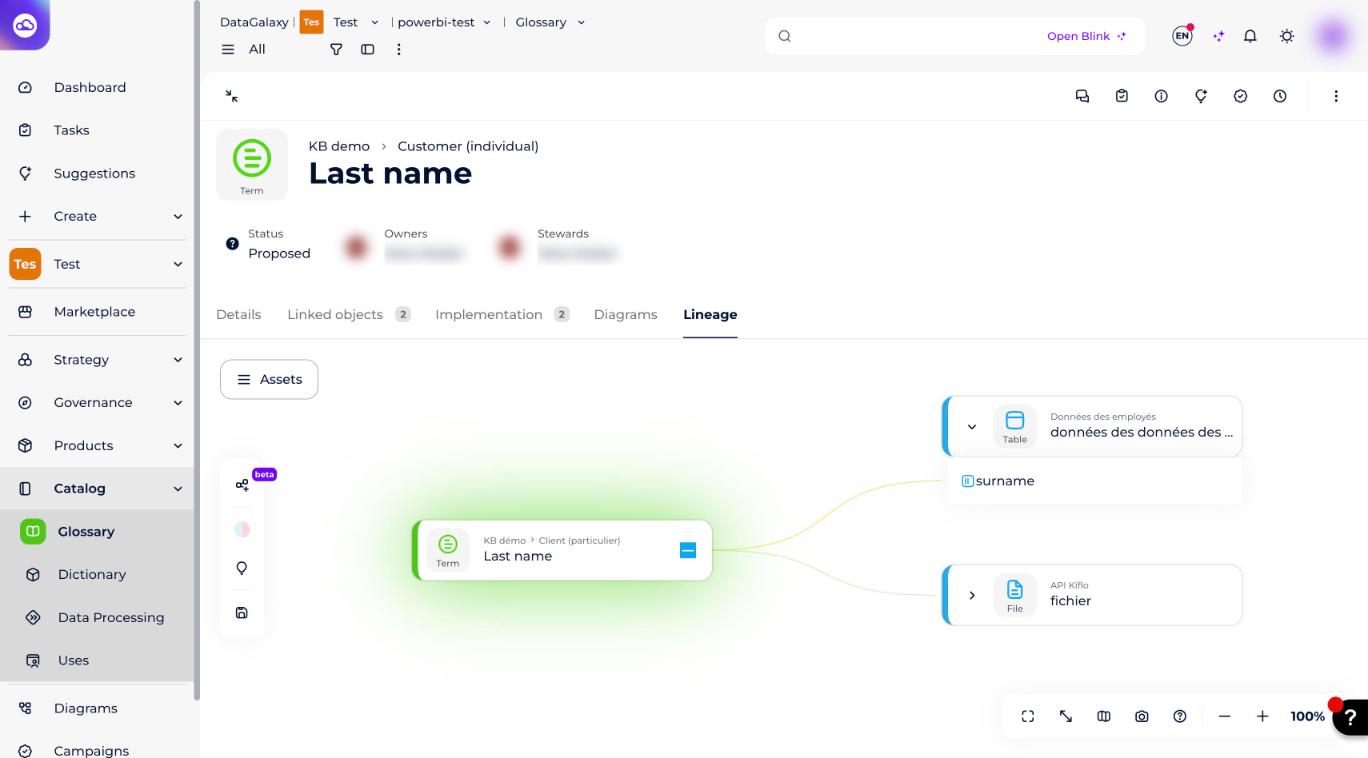
Between these two perspectives, lineage helps surface the different sources and how reputable each one is — for example, via golden links.
How to document data-quality remediation processes
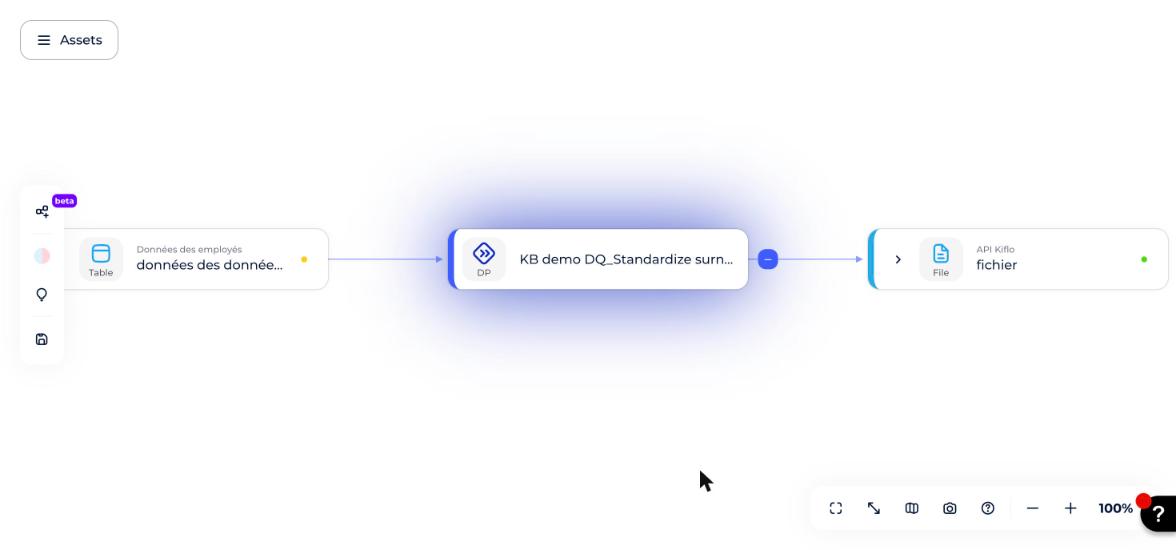
Once these steps are in place, you can move on to representing the processes that bring data up to quality standards. This happens in the Processing module. A quality-remediation process typically:
- Pulls data from a source A.
- Transforms it — enforcing a format, for example.
- Loads it into a "quality" container: a different table, another system, etc.
These processes can be:
- Prefixed, so they're easy to identify directly from lineage.
- Linked to the application used to run the quality-remediation process.
How to go further
As DMBOK points out, a data catalog is essential to surfacing quality initiatives — from defining business requirements all the way to delivering trusted foundations. You can go further by using the concept of processing: by defining which data is consumed by which business process, you can identify:
- Upstream: the processes generating incorrect data, and the possible remediations.
- Downstream: any risk from using poor-quality data, and its potential impact.