A time series attribute captures a value and its evolution over time. This article covers what they are, how they appear in object cards, and how to manage their values.
What is a time series in DataGalaxy?
A time series is an attribute type that captures and stores a value and its evolution over time. Time series can be used, for example, to monitor the variations of a quality indicator.
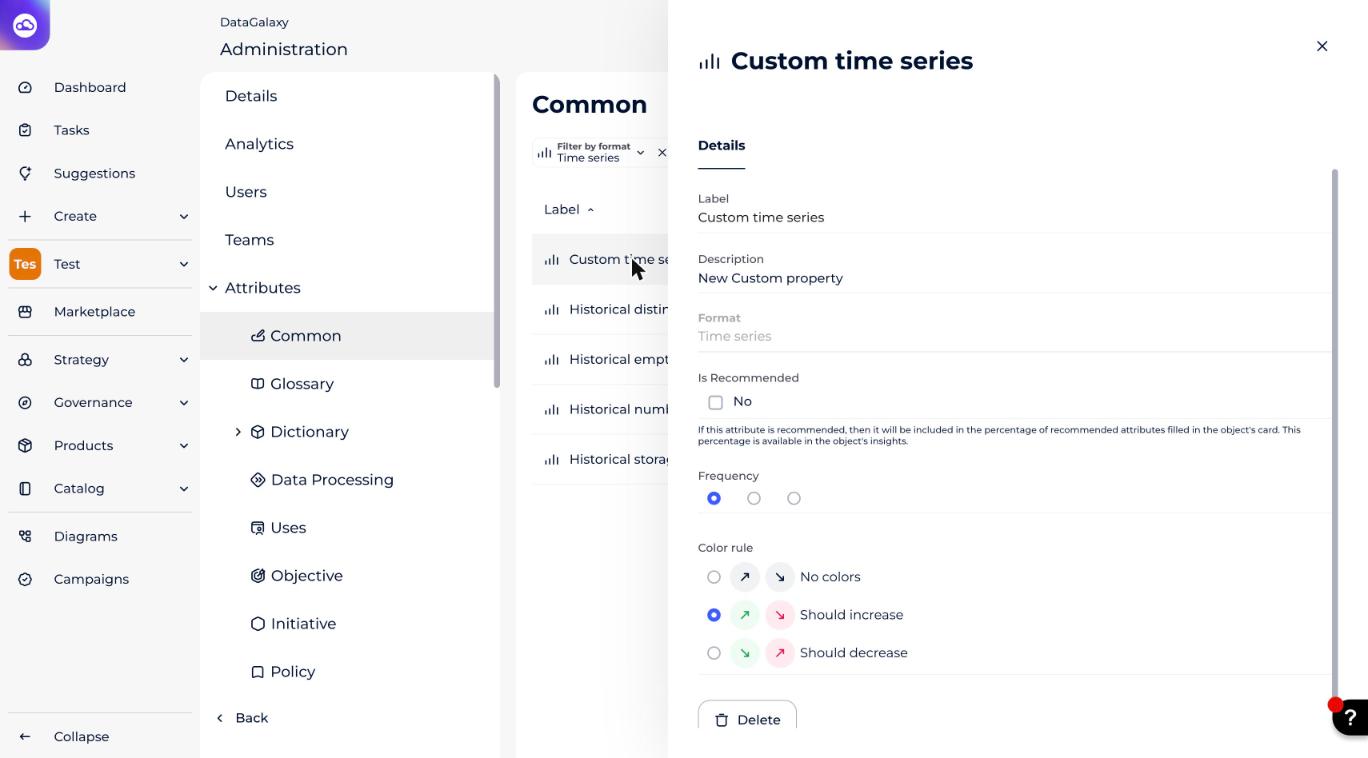
In the attribute administration, you can define the range of the values:
- Daily
- Weekly
- Monthly
If you choose weekly, for instance, you can only capture one value per calendar week for this time series.
You can also define the objective of the evolution of your time series (the Color rule setting), which has a visual impact:
- Should increase: the percentage of evolution between the last two values appears:
- in green if greater than or equal to 1%
- in red if less than or equal to -1%
- in gray if between -1% and 1% (excluded)
- Should decrease: the percentage of evolution between the last two values appears:
- in red if greater than or equal to 1%
- in green if less than or equal to -1%
- in gray if between -1% and 1% (excluded)
- No colors: the percentage change between the last two values appears in gray in all cases.
Who can manage time series?
To create time series, you must be a client space administrator. To check whether you have these rights, go to your profile and open the drop-down menu: the Administration option should be present. If it isn't, you are not an administrator. To learn more about the administrator profile in DataGalaxy, see Overview of License Management.
What do time series look like in an object card?
In the object card, the following information is displayed:
- A graph to monitor the evolution of the time series over its last ten value points: between consecutive values the evolution is represented by a solid line, and between non-consecutive values by dotted lines.
- The last value.
- The evolution between the last two values, in percentage.
- An edit button giving access to:
- the detailed history of the values of the time series
- a graph of all the values in the time series
- the import and export of the values of the time series
How to manage time series
1 — Import values
- Open the history panel of a time series.
- Click on the three small dots.
- Select Import values from the drop-down menu. The import window opens.
- Choose the option Add values.
- Choose the CSV file to import. The file must contain a header (whatever its name) for the following columns:
- Dates: expected format
yyyy-mm-dd
- Values: expected format integer or decimal
- Dates: expected format
- Associate the column headers of your CSV file with the corresponding parameters: Date and Value.
- Click on Import.
Example of the content of a file containing 2 values for a daily time series:
Date;Value
2020-02-01;3
2020-02-02;4
2 — Import objects from a module or source containing time series
When you import objects into a module or source, you can only import the latest value of the time series your objects contain. If a value already existed for the imported date, it is automatically updated with the imported one.
The values must be imported in the format Date::Value, with the date in the format yyyy-mm-dd.
Example of the content of an import file from the Glossary module containing 2 objects with 1 time series attribute each:
Functional label;Summary;Status;Time series
Address;Client address;Proposed;2021-04-30::28
Date of birth;Client date of birth;In validation;2021-03-23::78
3 — Export values
- Open the history panel of a time series.
- Click on the three small dots.
- Choose Export values in the drop-down menu.
4 — Add a value
- Open the history modal of a time series.
- Click on the Add a value button.
- Choose a date and fill in a value, then validate.
5 — Modify a value or a date
- Open the history mode of a time series.
- Click on the pencil icon that appears over the line to be modified.
- Modify the date or the value (or both), then click on the validation button.
6 — Delete a value
- Open the history modal of a time series.
- Click on the trash can icon that appears when hovering over the line to be deleted.
- In the confirmation window, click on the Delete button.
7 — Delete all values
- Open the history panel of a time series.
- Click on the Delete all values button.
- Click on the Delete button in the confirmation window.
8 — From the public API
CRUD actions are available on time series at the object card level:
- Retrieval of all the time series entries when reading an object card.
- Possibility to add or remove time series entries when creating or updating an object. For example, when creating an object in the Glossary (see the CreateProperty operation), you can add or remove the values of a time series.
- Custom attribute routes now support the time series type. For example, the custom attribute creation route (see the CreateAttribute operation).