DataGalaxy gives you a set of tools to document data, find it, understand it and share it. This is a map of them, and each section points you to where to learn more.
How to fill the catalog: the DataGalaxy connector
One of DataGalaxy's ambitions is to make governance operational. For that, a map of the data in your databases, flows and uses is a precious resource: how can you master a business concept if you don't know its physical implementation, its related fields, or the transformations it went through to reach a given use? Reverse engineering that by hand is prohibitive for some, and IT keeps changing daily.
The DataGalaxy connector answers this. It queries your databases, flow management tools and reporting tools and sends their metadata to DataGalaxy. It can populate three modules: the dictionary, the uses catalog and the data processing catalog.
There are two versions:
- The online connector: the simplest and fastest. It is used directly from the platform, with no download.
- The desktop connector: reserved for advanced users. It must be downloaded and installed before use.
Who can use it?
The connector can't create, modify or delete records in your databases, flow management or reporting tools, so it carries no risk for the objects they contain or for the tools themselves. You do need specific permissions to query your tools: each technology has its own article in the connector reference.
For a hands-on walk-through, see Quickstart: Importing Your First Data into Your Catalog. You can also import from a CSV file or create objects manually.
How to describe and organize your data
- Four modules structure the catalog: the Glossary (what), Uses (what for, for whom), the Dictionary (where) and Data Processing (how). See Modules overview.
- Attributes and tags describe and classify objects. See Presentation of Attributes and Manage Tags.
- Links between objects connect the physical location of data with its meaning, flows and uses. See Anatomy of Your Catalog: Objects & the Metamodel.
- Screens let you decide which attributes users see. See The DataGalaxy Workspace: Modules, Screens & Attributes.
How to find and understand data
- Search: the entry point to DataGalaxy for most users. It finds information, lets you refine results, and can be placed on the home page. See Use the search engine.
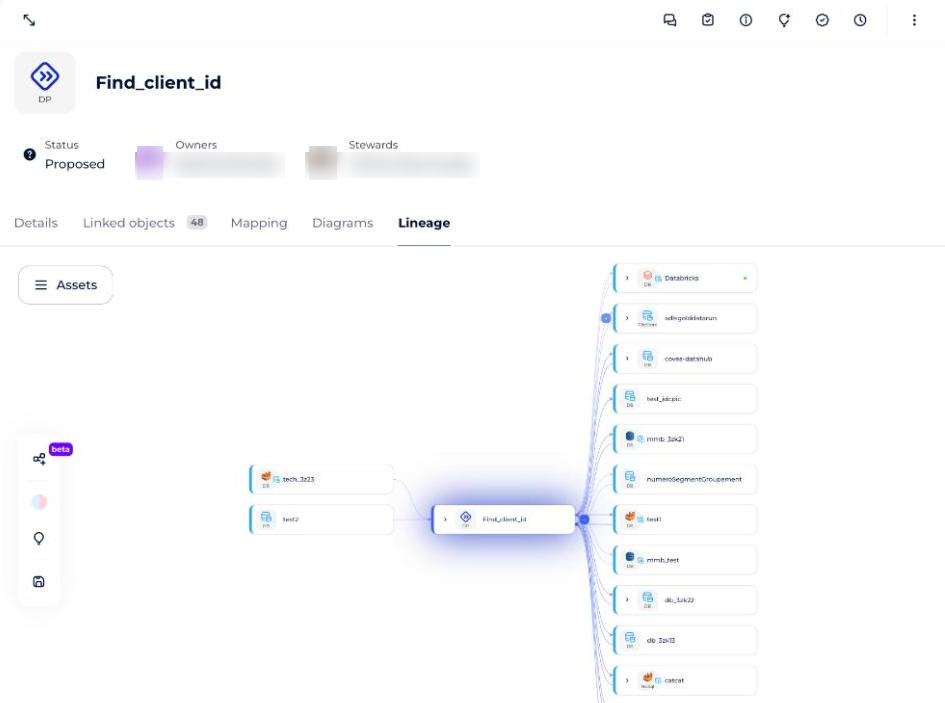
- Lineage and exploration: graphical views available on every object. Lineage shows the objects that impact an object and those it impacts; exploration shows all its links and is navigable.
- Filtered views: save a filtered list of objects that updates dynamically, and share it with all users. Combined with the Tabular view, they also allow bulk editing.
- Views and toggle: the Detailed, Tabular and Datamap views, and the technical/functional toggle. See Quickstart: Navigating the Platform for the First Time.
How to collaborate and keep the catalog alive
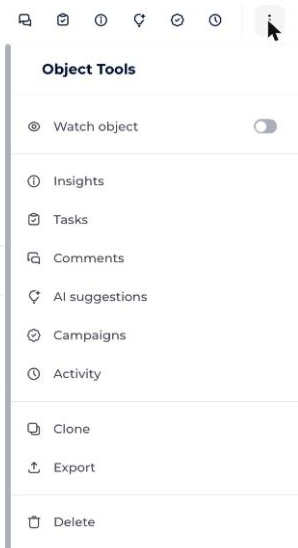
The tools at the top right of each object page support collaboration and follow-up: tasks, comments, AI suggestions, version comparison, activity log, campaigns (to follow workflows on a set of objects), and a follow function that notifies you of changes. You can notify colleagues with an @mention in any rich text field. All of these are described in Which tools are available on an object? in Quickstart: Navigating the Platform for the First Time.
How to learn at your own pace
DataGalaxy Academy offers easy-to-watch videos so you can learn at your own pace.