This quickstart gives you the lay of the land: where things are on screen, how to move around, and the few features that make navigating faster. It takes about five minutes.
What is in the top bar?

- Breadcrumb (top left): lets you move between parent pages (see How does the breadcrumb work?).
- Search bar: searches the workspace and version you are currently in. See Use the search engine.
- Bell: opens the notifications panel for tasks and comments. In any rich text field you can notify a user with an @mention (for example @JohnDoe) or a group of users; the mention becomes a link, and a counter in the bar shows how many new notifications you have.
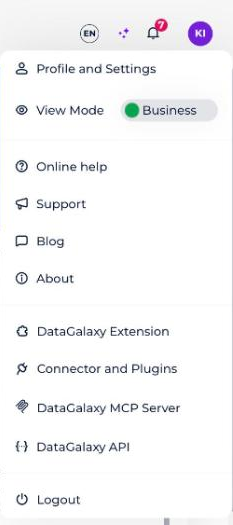
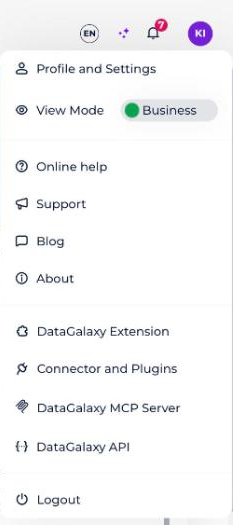
- Your icon: opens a menu where you can:
- open your profile by clicking your name;
- switch the platform between the technical and functional view (see How to switch between technical and functional names);
- reach the client space administration (administrators only);
- switch between all the client spaces you have access to;
- open the online help (see How to Access Online Help);
- send feedback, visit the DataGalaxy blog, check the current DataGalaxy version and its release notes;
- log out.
What is in the side bar?
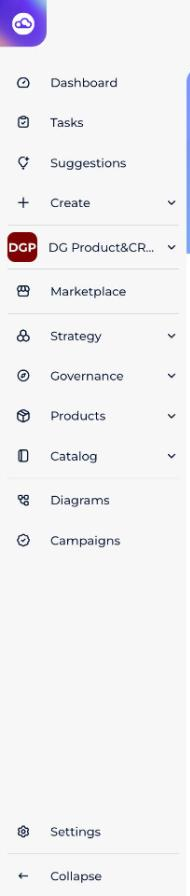
From top to bottom:
- Cloud icon: takes you to the client space home page for multi-workspace clients, or to the workspace home page for single-workspace clients.
- Dashboard icon: your dashboard.
- Magnifying glass: search.
- Task tray: all the tasks assigned to you or created by you.
- + button: adds an object. It only appears if you have creation rights.
- Workspace icon: shown only to multi-workspace clients when you are inside a workspace; it takes you to that workspace's home page.
- The modules: shown only when you are inside a workspace. Click an icon to switch module: Glossary module, Dictionary module, Data Processing Module and Uses module. For a map of all modules, see Modules overview.
- Impact analysis: available when you are inside a workspace.
- Team and Settings: reserved for workspace administrators.
How to choose how your objects are displayed
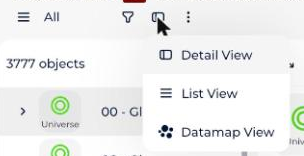
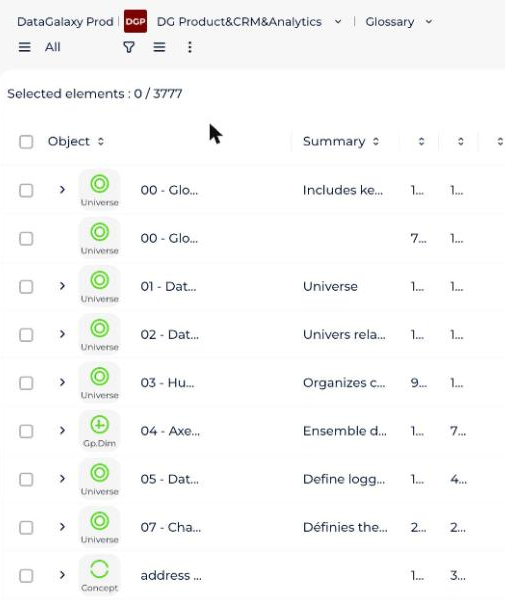
In every module you can display objects in a Detailed view or a Tabular view. In the Glossary, Data Processing and Uses modules you can also use the Datamap view.
- The Detailed view shows the information of one object.
- The Tabular view shows the information of all the objects in a table, and you can change which columns appear and where.
- The Datamap view shows all the data of the module hierarchically.
To switch view:
- Open the module of your choice. You land on the Detailed view by default.
- Click the icon to the right of your filtered view to move to the Tabular or Datamap view.
How to switch between technical and functional names
The toggle mode switches the whole platform between a functional view and a technical view, so you only see either the functional name or the technical name of objects. It helps different profiles get comfortable with the platform and understand the data.
It is most useful in diagrams, main search results, breadcrumbs, and the names of dictionary objects (tables and columns) in the detailed view, in the Data Processing mapping, in the Uses links and in impact analysis results.
You find the toggle in the profile menu at the top right.
How does the breadcrumb work?
The breadcrumb shows the path you took from the client space home page (from the workspace home page for single-workspace clients). It sits at the top left, right of the cloud, everywhere except in the administration. It is made of the client (not for single-workspace clients), the workspace, the version (if any), the module and the filtered view (if one is applied).
- Click a label to go to that parent page.
- Click the small arrow to the right of a label to open a drop-down and jump sideways to another page at the same level.
Where a click takes you:
- The client: the client space home page.
- A workspace: that workspace's home page. If the workspace is versioned, you land on the favorite version if there is one, otherwise the official one, then the most recent candidate, then the most recent version under construction.
- A version: the home page of the parent workspace in that version.
- A module: the list of the module's objects in the current version.
- A filtered view: the objects of that view.
Which tools are available on an object?
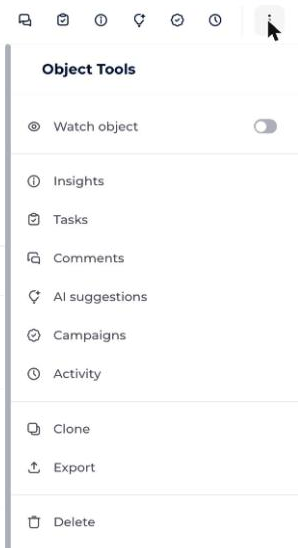
All the object tools are at the top right of an object page. The toolbar is contextual: it adapts to the object or workspace and shows the most frequent commands.
- Information: first-level information about the object: creation and modification dates, and the creator.
- Tasks: all tasks linked to the object.
- Comments: all comments on the object.
- AI suggestions: all AI-generated suggestions, with a counter for new ones.
- Version comparison: compare changes between versions of the object. Visible only when versioning is on.
- Activity: a chronological list of actions with links to the objects concerned. The home page shows all activity in the client space, and extra logs exist for organizations and sub-organizations, projects, models, glossary properties, data processing and uses objects.
- Campaigns: follow the execution of workflows on a set of objects.
- Follow the object: get a notification each time an object you follow changes.
The menu on the page also lets you clone, merge, export or delete an object.
Known limitations of the activity log
- You can't search in the log or apply advanced filters.
- You can't export the log; consult it in the interface.
- The Users filter lists all the users of the workspace, not only those who acted in the log, and you can't filter on a technical user.