This quickstart takes you from an empty workspace to your first populated catalog. It assumes no prior knowledge of DataGalaxy.
You will:
- bring in your first data, either from a database or from a spreadsheet;
- describe and model that data in business terms with the glossary;
- explore the links between objects with lineage and exploration;
- share what you've built with your colleagues.
What do you need before you start?
Client space, workspace, module: these are worth knowing. See The DataGalaxy Workspace: Modules, Screens & Attributes and Modules overview. If you haven't found your way around the screen yet, start with Quickstart: Navigating the Platform for the First Time.
Which starting point should you choose?
- You have databases to document: follow path A. You'll populate the dictionary with a connector.
- You already list your key data in a spreadsheet: follow path B. You'll populate the glossary from a CSV file.
You can do both. Then continue with the common steps.
Path A: import your data with a connector
Understand where the data goes
The dictionary answers the question where is the data stored? It is a shared representation of your data sources, structured or not, in a simple, collaborative environment. The other modules are the glossary (describe your data in business terms), data processing (the flows and transformations between sources) and uses (how data is used, in functional terms). See Dictionary module.
Launch the connector
The online connector queries your source tools, shapes their metadata and imports it into DataGalaxy. The connector can also be downloaded, in which case it is called the desktop connector. Either way you can query three kinds of tools: databases, reporting tools and flow management tools.
To start, click the Import button on your workspace home page.
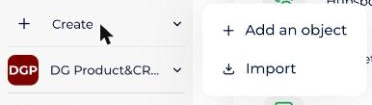
You need two things:
- A token: an authentication key that lets the connector push information into the platform. On first use, the online connector offers your Personal Access Token (PAT), which is tied to your account and has the same rights as you. Later you can use an integration token, which is tied to the client space and has specific rights. See Generate Tokens to Communicate with the API.
- A destination database: where the connector pushes the information. You can create it directly from the online connector, and the list of types is filtered when you pick the technology.
Some technologies need special permissions: each technology has its own article in the connector reference.
The import takes from one minute to a few hours depending on the volume of metadata. You can carry on with this quickstart in the meantime.
Describe your data in business terms
The glossary answers the question which data is used? It is a repository of definitions that helps put data in context, made of several types of objects to model, classify and document your data. See Glossary module.
You can create glossary objects manually, or import some of your dictionary data into the glossary. That lets you reuse technical elements while arranging them to give them business meaning, and it creates the link between each technical item and its business counterpart, which lineage needs.
Path B: start from a spreadsheet
The glossary can be populated three ways: by importing a CSV file (the fastest way to start), by importing some dictionary data (which automatically links each term to its technical counterpart), or by creating objects manually. If you have already listed your organization's key data in a spreadsheet, a CSV import is the best start.
Format your CSV file
Two columns are mandatory:
Path: the name of your object and its hierarchical chain. Every object has a path, which is its unique key. To start you can enter only the object's name, and add its parents later.
Type: the type of object you want to create. Each module has its own object types.
For example, to create a KPI called "Net Margin 3" and a business term called "Revenue":
| Path | Type |
|---|---|
| Net Margin 3 | Indicator |
| Revenue | Business term |
Summary and description columns are optional.
Import it
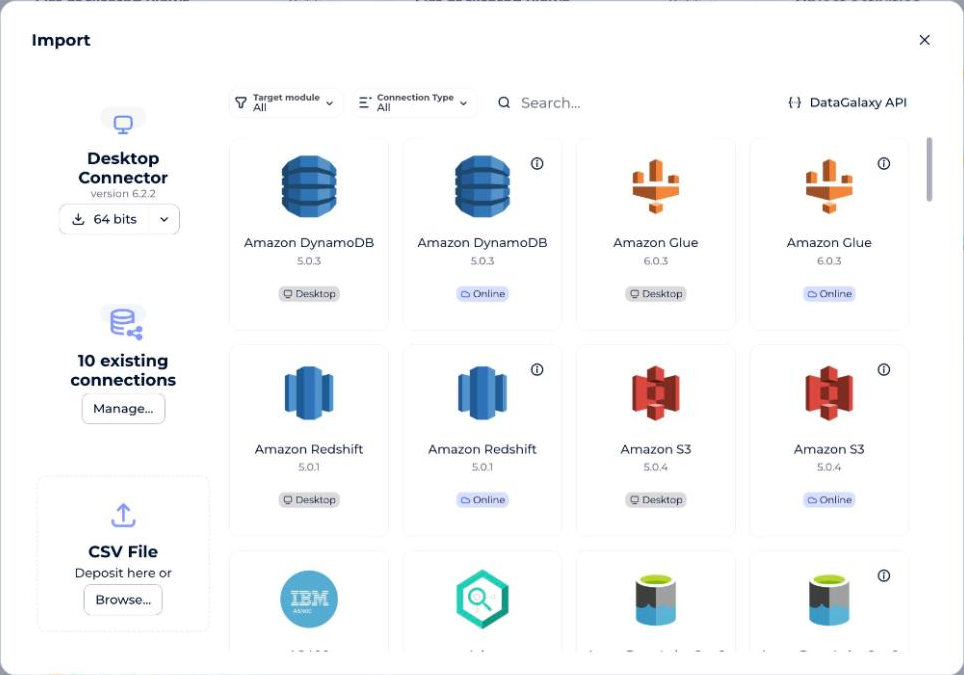
- Click the Import button on your workspace home page. The import wizard opens.
- Choose the CSV file option and select your file.
- Pick the target module and the type of information you are importing.
Describe and model your objects
By default, an object card has attributes that let you describe the object. See Presentation of Attributes. You can specify:
- Its life cycle: whether the object was just listed, validated, or is obsolete. By default, new objects are created with the status Proposed, and depending on the status, the ability to edit the other attributes can be restricted.
- Its governance: each object shows the roles of Owner and Steward by default, filled in automatically, which give those users extended editing rights.
- Tags: to classify objects easily; create as many as you need. See Manage Tags.
- A summary and a description, to clarify how the object is used.
To make a long, flat list of objects easier to understand, you can organize the glossary with universes, concepts and indicator groups.
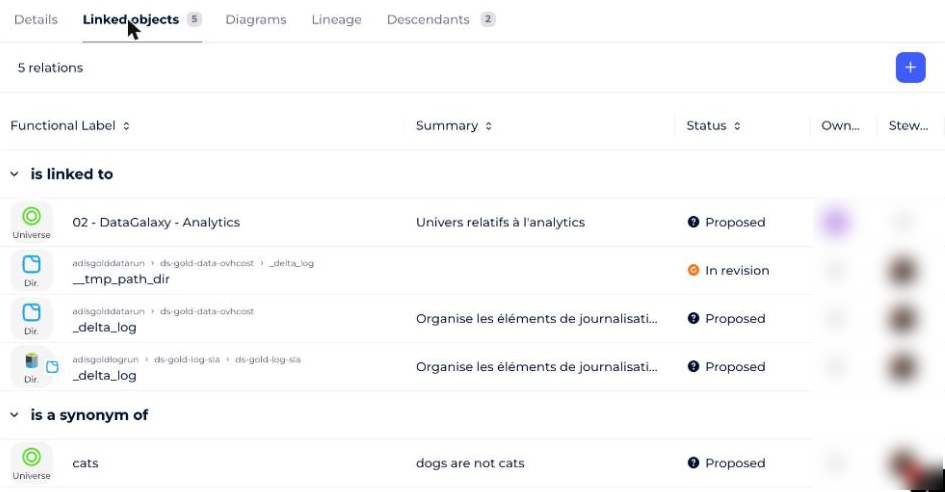
You can also link objects together, which is one of DataGalaxy's strengths. For example, one indicator can be calculated by another indicator. The easiest way to create links is the service panel of the object.
How to visualize your data
Once your objects and their links exist, open any object and go to its Lineage tab. It offers two representations:
- Lineage: shows the traceability of an object, that is, the objects it impacts and the objects that impact it.
- Exploration: shows all the links of an object, whether they are feeding links as in lineage or relationships between objects. It is also navigable.
How to share what you've built
Two tools make your information available:
- Filtered views: filter a module to show only the objects you care about, for example a given tag. They update dynamically, can be saved and shared with all users, and combined with the Tabular view they give a very good understanding of a data scope. The Tabular view also lets you edit objects in bulk.
- Search: often the entry point to DataGalaxy. It finds information quickly, lets you refine results, and can even be placed on the home page. See Use the search engine.
What can you do next?
Open the client space administration to configure your space, add attributes and tags, and invite new users. Enjoy exploring!